How to read the Histogram in the CBC?

The result show in the CBC including Number and Graph this
graph called histogram. A
CBC histogram is a graphical representation of the distribution of
different blood cells in a Complete Blood Count (CBC) test. It provides
valuable insights into the size and number of red blood cells (RBCs), white
blood cells (WBCs), and platelets (PLT) of tested sample.
Table
of content
How to
Interpret a CBC Histogram?
WBC Histogram
(White Blood Cell Distribution)
RBC Histogram
(Red Blood Cell Distribution)
Platelet
Histogram (Platelet Size Distribution)
Importance of CBC Histograms in
Laboratory Quality Control
Frequently Asked Questions (FAQs)
Histograms in CBC are useful because
they help in identifying abnormalities in blood cell populations, such as anemia,
infections, or platelet disorders. Each histogram plots the size
(x-axis) against the relative count (y-axis) of the cells, allowing for a
quick visual assessment of variations in cell distribution. By analyzing these
histograms, healthcare professionals can detect conditions that may require
further investigation or treatment.
The
importance of the CBC histograms come from the ability to detecting abnormal
distributions of blood cells, which may indicate conditions like infections,
anemia, or platelet disorders.
Also they provide a quick and
efficient way to assess variations in blood cell populations, any
abnormality in histogram patterns can suggest the need for further
diagnostic tests or medical evaluation.
The
Main CBC Histograms:
- Represents the distribution of white blood cells
based on their size.
- Helps in distinguishing between different types of
WBCs and detecting infections or blood disorders.
- Shows the distribution of red blood cells by
their size (Mean Corpuscular Volume – MCV).
- Useful in diagnosing conditions like anemia,
microcytosis, or macrocytosis.
- Illustrates the size distribution of platelets.
- Helps in detecting thrombocytopenia (low platelet
count) or thrombocytosis (high platelet count), which can
indicate bleeding disorders or bone marrow diseases.
How
to Interpret a CBC Histogram?
Normal
WBC Histogram Curve:
Shows a smooth, single peak curve, it indicates a balanced distribution of different WBC types: small lymphocytes, medium-sized (monocytes, eosinophils and basophils), and larger granulocytes neutrophils.

Abnormal
WBC Histogram Curves:
- Left Shift
That
showun when a Immature Cells Presence, which
shifts towards smaller cell sizes indicates an increase in immature white
blood cells (e.g., band neutrophils or blasts). Common seen in bacterial
infections, leukemia, or bone marrow disorders. Example Condition: Acute
Infection or Leukemia. Which the body produces more immature WBCs to fight
infections, which are smaller in size, causing a left-sided curve shift.


This condation for the ALL (Acut lymphoblastic leukemia)
- Right Shift
The curve shifts towards larger cell sizes, suggests an increase in monocytes or abnormal cells. Common in chronic infections, mononucleosis, or myelodysplastic syndromes. That happened because of that larger monocytes increase in number, creating a rightward curve shift.

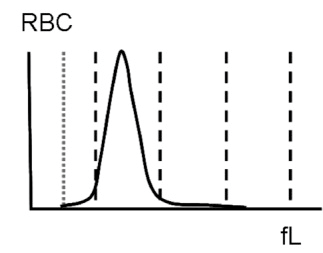
Ø RBC Histogram (Red Blood Cell
Distribution)
- X-axis represents
the size of RBCs (measured in femtoliters, fL).
- Left side
Microcytic (smaller RBCs, <80 fL)
- Middle Normocytic
(normal RBCs, 80-100 fL)
- Right side Macrocytic (larger RBCs, >100 fL)
- Y-axis:
Represents the number (count) of RBCs at each size range.
Normal
RBC Histogram Curve:
- A bell-shaped curve centered around 80-100 fL,
which corresponds to the normal Mean Corpuscular Volume (MCV)
range.
- Indicates a balanced and uniform distribution of RBC
sizes.

Abnormal
RBC Histogram Curves and Their Clinical Significance:
- Microcytic Anemia
The curve shifts to the left
(smaller RBCs) in a cause of Iron deficiency leads to smaller RBCs
(microcytes). Explanation of that is RBCs become smaller due to
insufficient hemoglobin production, leading to a leftward shift in the
histogram.
- Macrocytic Anemia
The curve shifts to the right
(larger RBCs) as can be seen in Vitamin B12 or folate deficiency leads to larger
RBCs (macrocytes) example condition in Megaloblastic Anemia (B12
Deficiency). Which imbalance DNA synthesis and cell maturation causes RBCs
to grow larger before being released into circulation, leading to a rightward
shift.
- Anisocytosis (High RDW - Red Cell Distribution Width)
The curve becomes broader due
to a wider range of RBC sizes. Conditions like iron deficiency and
vitamin B12 deficiency, mixed anemias can cause significant variation in
RBC sizes. Which presence of both small (microcytic) and large (macrocytic)
RBCs results in an irregular, widened histogram.
Ø Platelet Histogram (Platelet Size
Distribution)
Platelet Histogram (Platelet Size Distribution)
A platelet histogram is a graphical representation of platelet
size distribution. It helps in diagnosing platelet-related
disorders, including low platelet counts (thrombocytopenia),
high platelet counts (thrombocytosis), and abnormal platelet
sizes.Normal Platelet Histogram Curve:
A smooth peak within the 7-10 fL range, indicating a balanced distribution
of platelet sizes. Most platelets are small and uniform in
size.
Abnormal Platelet Histogram Curves and Their Clinical Significance:
1. Thrombocytopenia
Small peak with a left shift (fewer and smaller platelets). Shown in bone
marrow suppression, immune disorders, or excessive platelet destruction, as Immune Thrombocytopenia (ITP) which reduced number
of platelets leads to a lower peak, with more small platelets dominating the
distribution.
2. Thrombocytosis
Higher peak, sometimes with a right shift if larger platelets are present. Shown reactive
thrombocytosis (due to inflammation or infection) or primary bone marrow disorders.
Like Essential Thrombocythemia. Which
the body produces excessive platelets, increasing the overall count and
sometimes shifting the histogram towards larger platelets.
3. Giant Platelets
Broadened peak or dual peaks (indicating two distinct platelet
populations). In bone marrow disorders like myeloproliferative
diseases or Bernard-Soulier syndrome. Which the presence of abnormally large platelets creates a broad or
double-peaked histogram due to size variation.
Importance
of CBC Histograms in Laboratory Quality Control
In a laboratory setting, CBC
histograms play a crucial role in quality control, ensuring the accuracy
and reliability of complete blood count (CBC) results. During a lab
interview, understanding the significance of histograms in quality control
demonstrates knowledge of data validation, troubleshooting, and result
interpretation.
- Detection of Instrument Errors:
- Automated hematology analyzers generate histograms,
and any irregular or unexpected patterns can indicate instrument
malfunction, such as clogs, calibration issues, or electronic errors.
- Example: Abnormally spiked histograms may
suggest sample contamination or analyzer misreading.
- Verification of Abnormal Blood Samples:
- Histograms help in cross-checking numerical CBC
values, confirming whether abnormalities in RBC, WBC, or platelet
counts are due to patient conditions or possible errors.
- Example: A left-shifted WBC histogram with
abnormal peaks might indicate immature white cells but could also be due
to poor sample quality.
- Identification of Sample Issues (Pre-analytical
Errors):
- Histograms help detect errors related to sample
collection, handling, or anticoagulant effects.
- Example: Clotted samples may show an irregular
platelet histogram, indicating falsely low platelet counts (pseudothrombocytopenia).
- Monitoring Analyzer Performance Over Time:
- Consistent histogram patterns help in long-term
quality monitoring of the hematology analyzer’s performance.
- Unstable or shifting histogram trends over multiple samples may indicate the need for maintenance
or recalibration.
- Enhancing Diagnostic Accuracy and Confidence:
- Histograms serve as a secondary check for abnormal
results, ensuring that any flagged readings are valid before reporting to
clinicians.
- They also help in detecting conditions such as dual
RBC populations in blood transfusions or mixed anemias, which may not
be immediately evident from numerical data alone.
Frequently Asked Questions (FAQs)
1. What is a CBC histogram?A CBC histogram is a graphical representation of the size
distribution of red blood cells (RBCs), white blood cells (WBCs), and
platelets (PLTs) in a blood sample. It is generated by automated
hematology analyzers to help detect abnormalities in blood cell populations.
2. How do I read a histogram?
- X-axis: Represents cell size
- Y-axis: Represents cell count.
- Normal Curve: have a balanced distribution of
the cell.
- Abnormal Findings:
- Left Shift (small cell)
- Right Shift (large cell)
- Anisocytosis Broader peak due to mixed RBC
sizes (high RDW).
- Giant Platelets: Broad or dual peaks (seen in
bone marrow disorders).
3. Why is my histogram showing a broader peak?
A broader peak suggests anisocytosis,
which means high variation in cell size. This is commonly seen
in mixed anemia (iron and B12 deficiency) or certain blood
disorders.
4. Can a CBC histogram diagnose diseases?
No, a CBC histogram alone cannot diagnose diseases, but it
helps detect abnormalities that guide further testing. A doctor will correlate
the findings with CBC parameters, symptoms, and additional tests
for an accurate diagnosis.
5. What should I do if my CBC histogram is abnormal?
If your CBC histogram shows abnormal patterns, consult a healthcare
professional. They may recommend further blood tests, bone marrow
evaluation, or imaging to identify the underlying condition.
Conclusion
CBC histograms provide valuable visual insights into blood
cell distribution, helping detect abnormalities in red blood cells
(RBCs), white blood cells (WBCs), and platelets (PLTs). They
complement the numerical results of a CBC test, allowing for a
more detailed assessment of conditions such as anemia, infections, and
platelet disorders.However, while histograms can highlight potential issues, they do
not replace a medical diagnosis. Always consult a healthcare
provider for accurate interpretation and further testing if needed. A
professional evaluation ensures that any underlying health conditions are
properly diagnosed and treated.


Comments
Post a Comment
Our goal is to simplify lab test interpretation and share the latest research in clinical laboratory sciences. Do you have an experience or question to share? We welcome your discussion in the comments.
هدفنا هو تبسيط قراءة نتائج التحاليل الطبية ومشاركة أحدث الأبحاث في المختبرات الطبية. هل لديك تجربة أو استفسار؟ نرحب بمناقشتك في التعليقات!